
Analytics
Track your trading performance with comprehensive analytics. Monitor key metrics, analyze profitability, and make data-driven decisions to improve your trading strategies.
Introduction
TradeSgnl Analytics provides comprehensive insights into your trading account performance, allowing you to track key metrics and make data-driven decisions to improve your trading strategies.
The number of concurrent accounts you can monitor depends on your plan. Advanced and Professional users can monitor 3 and 10 concurrent accounts respectively.
Getting Started
Setting up analytics for your trading account is simple.
Run the TradeSgnl MT5 EA. Make sure you're using the latest version of the MT5 EA. You can download the latest version from your Dashboard Download page.
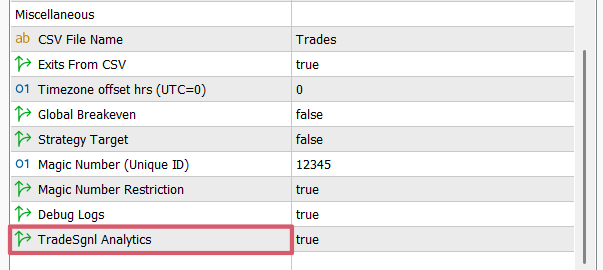
Enable Analytics in EA Settings. In your EA settings panel, scroll to the bottom section and enable the "TradeSgnl Analytics" option.
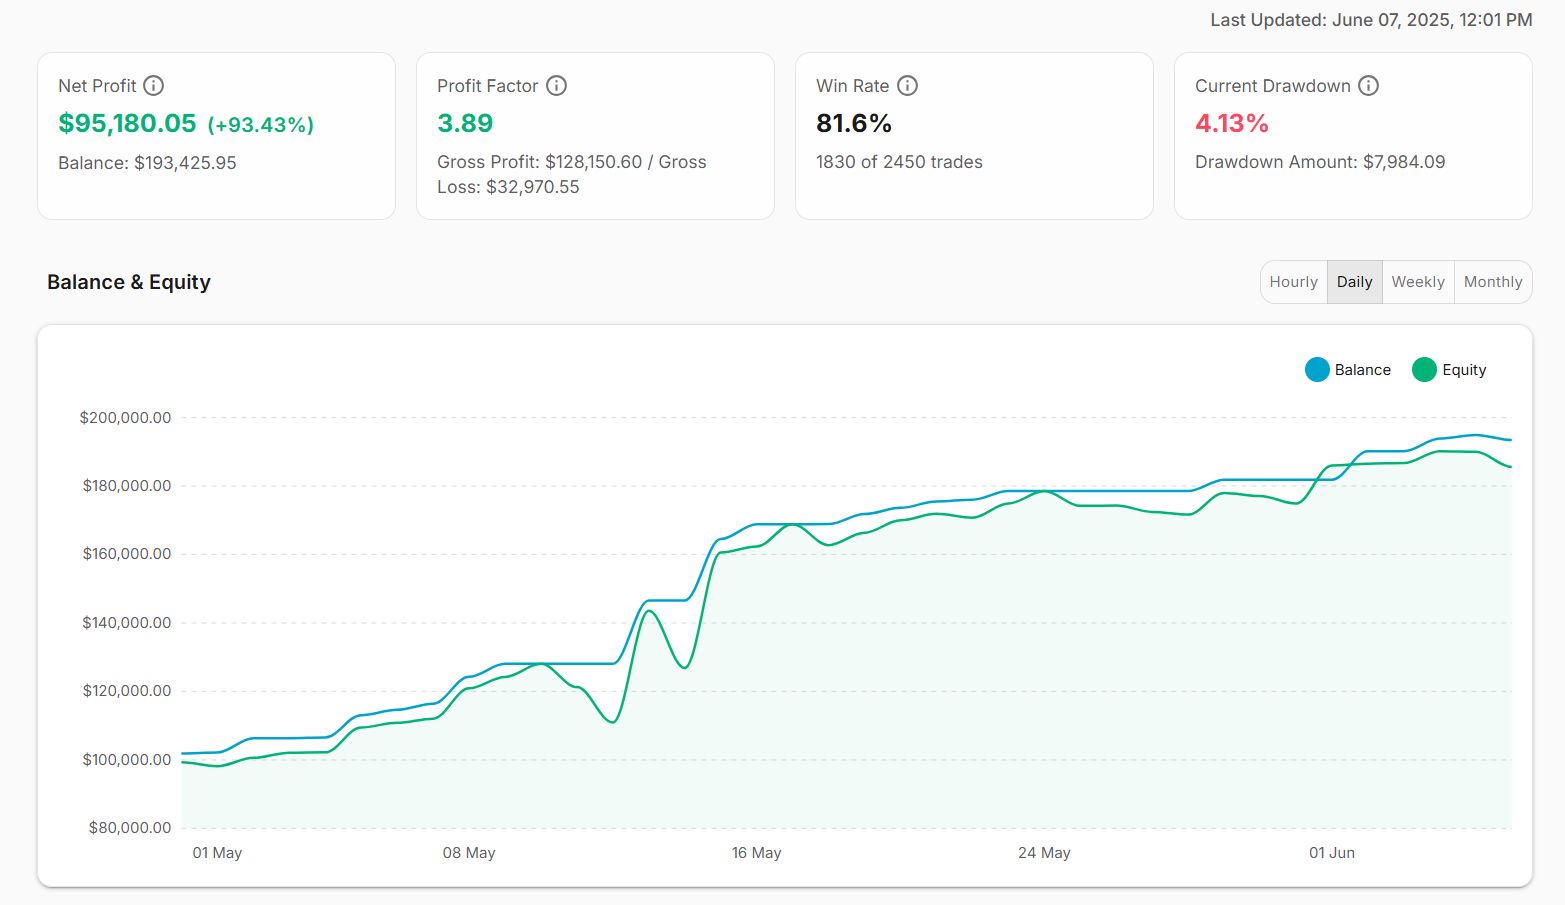
View Your Analytics Dashboard. Visit the Analytics section of your TradeSgnl dashboard. Depending on your trading history volume, it may take a few minutes for all data to process and display.
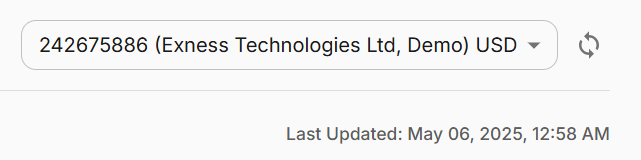
Select Your Trading Account. Use the account selector dropdown in the upper right corner of your analytics dashboard to choose which trading account you want to analyze.
- Only connected accounts will appear in the dropdown. If you don't see your account, ensure the EA is properly installed and running with Analytics enabled.
- Switch between multiple accounts. If you have multiple trading accounts connected, use the dropdown to switch between them and view each account's analytics.
- Refresh data as needed. Use the refresh button next to the account selector to update your analytics data on demand.
FAQ
Understanding Profitability Across Trading Systems
A common misconception is that profitable trading requires both high win rates and high reward-to-risk ratios. In reality, understanding the relationship between these factors is key to building sustainable trading systems.
Relationship between reward-to-risk ratio and breakeven win rate
| Reward-to-Risk | Breakeven Win Rate |
|---|---|
| 0.5 | 67% |
| 1 | 50% |
| 2 | 33% |
| 3 | 25% |
| 5 | 17% |
| 10 | 9% |
For example, a system with a 2:1 reward-to-risk ratio only needs a 33% win rate to break even. At a 40% win rate, the same system becomes solidly profitable over time.
To evaluate your trading system's true potential, calculate its expectancy, the average profit or loss you can expect per trade.
Expectancy Formula
Expectancy = (Win Rate × Average Win) − (Loss Rate × Average Loss)Where:
- Win Rate: The percentage of trades you win.
- Loss Rate: The percentage of trades you lose, or (1 - Win Rate).
- Average Win: The average profit from winning trades.
- Average Loss: The average loss from losing trades.
Example Calculation
If your win rate is 40% (0.4), your loss rate is 60% (0.6), your average win is $100, and your average loss is $50:
Expectancy = (0.4 × 100) − (0.6 × 50)
Expectancy = 40 − 30 = $10
With a positive expectancy of $10 per trade, this system is profitable in the long run despite having more losing trades than winning ones.
TradeSgnl Analytics helps you track these critical metrics across your trading accounts, enabling you to fine-tune entry timing, exit strategies, and position sizing to optimize your expectancy and overall profitability.