
Market Analyst
A conviction-gated market analyst inside your portal. Pick any symbol and a trading style, and the AI reads live market structure, levels, momentum, and volatility, then either lays out a trade scenario with an invalidation level or tells you to stand aside.
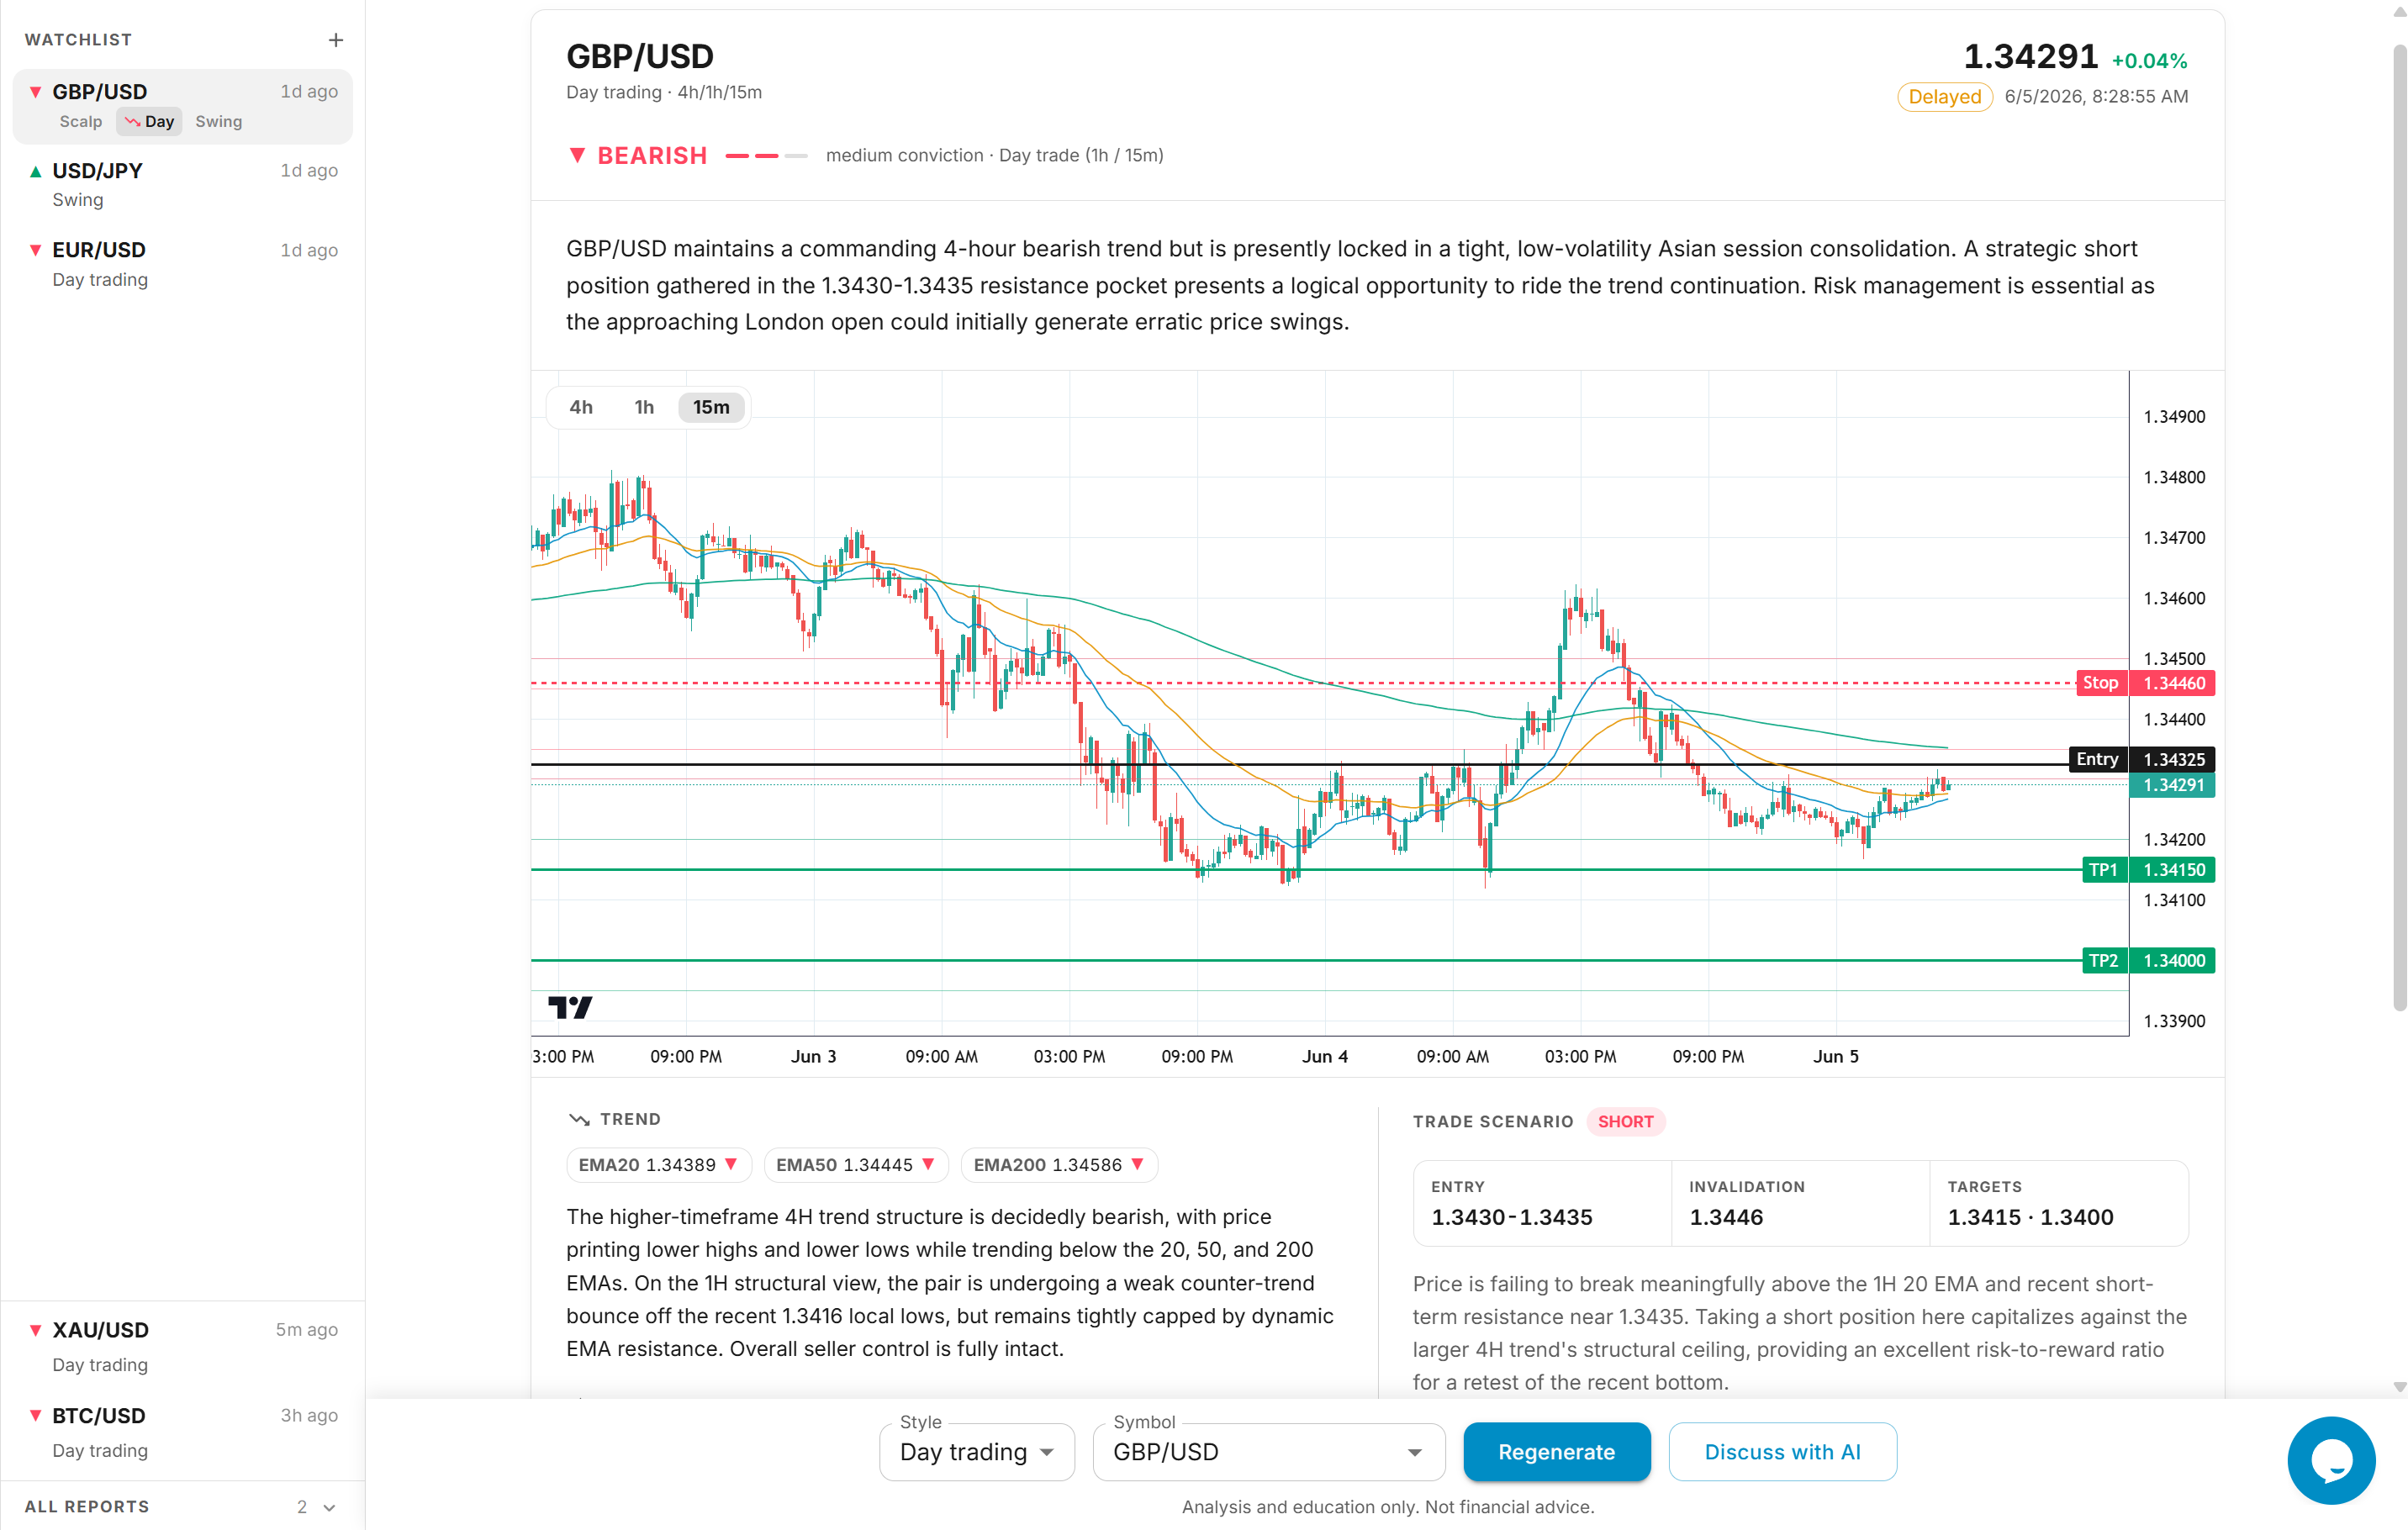
Overview
The Market Analyst is an AI that reads the market for you. Open it from your portal, pick a symbol and a trading style, and it pulls live price data, computes the indicators a discretionary trader would check, and returns a structured read: where the trend sits, the key levels, what momentum and volatility are doing, and whether there is a clean setup worth taking.
The part that makes it different is restraint. The analyst only calls a trade when the structure earns it. When the chart is mid-range or the signals conflict, it says so and explains what would need to happen to form a setup. "Stand aside" is a valid answer, not a failure.
Structured report
A directional bias with a conviction rating, key support and resistance, a momentum and volatility read, and a trade scenario with an entry, an invalidation level, and targets.
Discuss with the AI
Once a report is open, ask follow-up questions. The assistant has the report pinned as context and can pull a fresh quote or extra timeframes on demand.
Where to find it
The Market Analyst lives in your portal navigation. It is available on Advanced and Professional plans.
Generate a Report
A report is built from two choices: which symbol, and how you trade it.
Open the Analyst. From your portal, go to Analyst. On first use you will see a short note confirming the analyst is for analysis and education only.
Pick a trading style. In the composer at the bottom, choose Scalping, Day trading, or Swing. The style sets which timeframes the analyst reads, so the same symbol gets a different read depending on how long you intend to hold.
Pick a symbol. Search by name or ticker. The analyst covers forex, stocks, crypto, indices, and commodities.
Click Analyze. The analyst fetches live data, computes the indicators, and returns the report in a few seconds. Each generated report is timestamped and saved.
Trading Styles
Every style reads three timeframes at once, in a hierarchy a discretionary trader would recognise: a trend frame for the big-picture direction, a structure frame to define the setup, and a trigger frame for entry timing.
| Style | Trend | Structure | Trigger |
|---|---|---|---|
| Scalping | 1H | 15M | 5M |
| Day trading | 4H | 1H | 15M |
| Swing | 1W | 1D | 4H |
Because the timeframes differ, a symbol can read bullish for a swing trader and neutral for a scalper at the same moment. That is expected, and it is why the style is part of the report rather than a global setting.
Reading the Report
Each report follows the same layout, so you learn where to look once.
Bias and conviction
The header shows the direction (bullish, bearish, or neutral) and a conviction rating of one to three. Conviction reflects how cleanly the structure lines up. A neutral bias with low conviction is the analyst being honest about a messy chart, not a weak attempt at a call.
The read
The left column is the structural read, in plain English backed by the numbers:
Trend
Where price sits relative to its moving averages (EMA 20, 50, and 200) on the trend frame.
Momentum
RSI and MACD across the frames, shown as a gauge so you can see overbought or oversold at a glance.
Volatility
Average True Range per frame, which sizes how far price is swinging and informs stop distance.
Key levels and the chart
Support and resistance are expressed as zones, not single prices, and drawn directly onto the candlestick chart along with the moving averages. When there is a trade scenario, its entry, stop, and targets appear as lines on the same chart, so the plan and the price action are read together.
Levels are zones, not exact ticks
Levels and entries are shown as small ranges (for example 1.0890 to 1.0900). Live feed prices and your broker's prices differ slightly, so a zone is more honest than a to-the-decimal number you cannot fill at.
Trade scenario, or stand aside
If the structure supports a trade, the right column lays out a scenario: a direction, an entry zone, an invalidation level where the idea is wrong, targets, and the rationale, with an approximate risk-to-reward to the first target.
If it does not, the analyst says Stand aside — no clean setup and explains what would need to happen for one to form. This is the feature working as intended. A tool that finds a trade on every chart is a tool that loses you money on the charts that had no trade.
Risks
Most reports close with a short list of risks specific to that read: a nearby news event, a level that has not been tested, a session about to close. They are the caveats a careful analyst would mention out loud.
Open vs Generate
The analyst draws a clear line between reading a saved report and paying for a fresh one.
- Open retrieves a report that already exists. It is free, and it shows you exactly how old it is. If it is more than twenty minutes old it is marked Delayed, so you are never looking at stale analysis without knowing.
- Generate (the Analyze and Regenerate buttons) runs a new analysis on live data. This is the action that uses your AI credits.
To keep billing honest, clicking Regenerate always runs a genuine fresh analysis rather than charging you for a cached result. (A report generated in the last sixty seconds is reused to prevent an accidental double-charge from a quick second click.)
Watchlist and Feed
The left rail is your home base.
My Watchlist
The symbols you follow. Each row shows the latest bias per style and how long ago it was run. Click an analysed style to open its report for free, or run a style that has not been analysed yet.
All Reports
A live feed of the newest analyses across the platform. Add any symbol to your watchlist with one click to start following it.
Adding and removing symbols only curates your own view. Reports themselves are never deleted, so the shared archive stays intact.
Discuss With the Analyst
Open report in front of you, and the Discuss with AI button hands it to the assistant as context. From there you can ask anything:
What would flip this from neutral to bullish?

Is the 4H structure as clean as the 1H?

Where would you move the stop if price retests 1.0900?

What's the current price right now?
The assistant answers from the pinned report and can fetch a live quote or an extra timeframe that was not in the original snapshot. It will not contradict the report it was handed, and it frames any call the same way the report does: as a scenario with an invalidation level, never a promise.
Credits
Generating a report and chatting with the analyst both draw on AI credits, the same balance used across TradeSgnl's AI features. Each plan includes a monthly pool of credits, and you can top up at any time on the Billing page.
Only genuinely new analysis is charged. Opening a saved report is free, and so is the brief reuse window that stops an accidental double-click from charging you twice. You spend credits when the analyst actually runs.
If the analyst is briefly busy
Each fresh analysis pulls live market data from an external feed. During a spike in demand the feed can throttle, and the analyst will ask you to try again in a moment rather than return a degraded report. When that happens you are not charged.
Important
Analysis and education only
The Market Analyst provides analysis for educational purposes. It is not financial advice and not a recommendation to buy or sell any instrument. Every scenario it describes is conditional and can be invalidated by the market. You are responsible for your own trading decisions and risk management.